Engagement Rate Benchmarks 2026: What Counts as Good on Instagram, TikTok and YouTube
Engagement rate benchmarks are the quickest way to tell whether an audience is real and awake, which is why brands check the figure before they look at anything else on a creator’s profile. The difficulty is that the “average” engagement rate quoted in most articles is a single number that hides enormous differences between platforms and between a 3,000-follower account and a 300,000-follower one.
This guide sets out the 2026 engagement rate benchmarks by platform and tier from a dataset of 141.7 million active creators, explains how the figure is calculated and why the median matters more than the average, shows what “good” means for your size, and covers how engagement rate benchmarks feed into pricing, how brands spot inflated figures, and how creators lift the rate honestly.
Check any creator’s engagement rate against the benchmarks with the free ZOMZEY calculator, then price the post with the pricing calculator. No sign-up needed.
How engagement rate is calculated
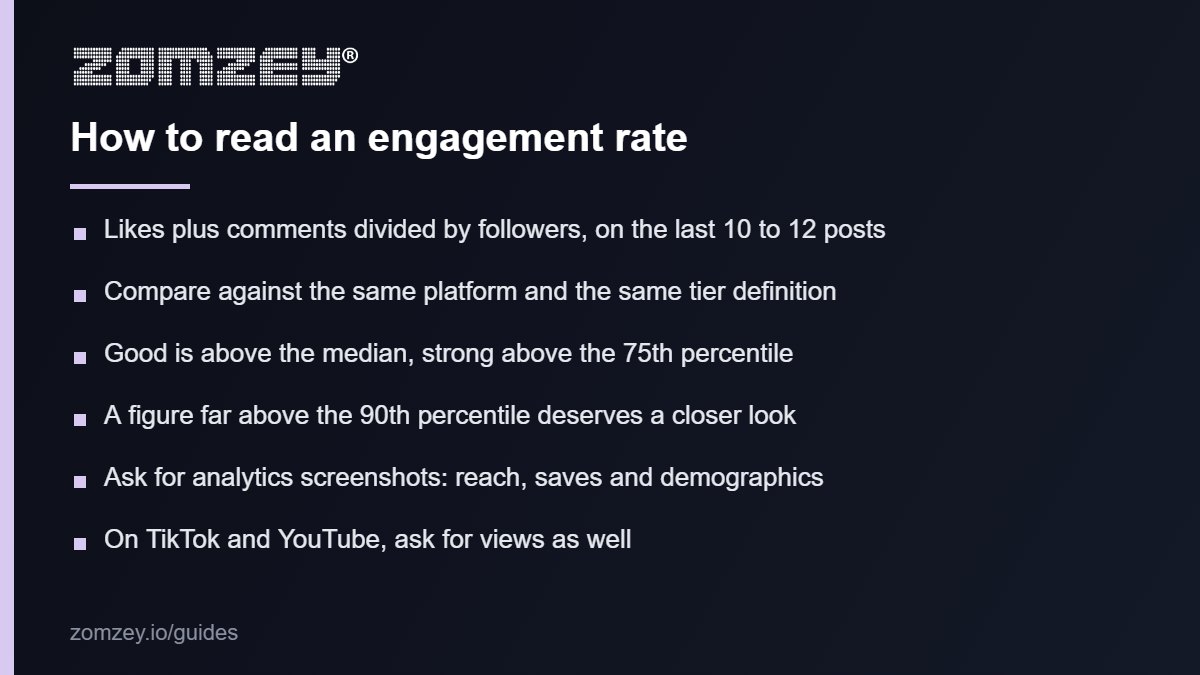
The standard definition, and the one used by the benchmarks below, is the average number of likes and comments on a creator’s recent posts divided by the follower count, expressed as a percentage. Saves, shares and views are not counted, and on YouTube the denominator is subscribers. Some brands prefer engagement by reach (interactions divided by the number of people who saw the post), which is fairer to creators whose posts travel beyond their followers, but it needs the creator’s own analytics. When you compare a creator against engagement rate benchmarks, make sure both figures use the same definition; a by-reach figure will usually look higher than a by-follower one.
Engagement rate benchmarks by platform and tier, 2026
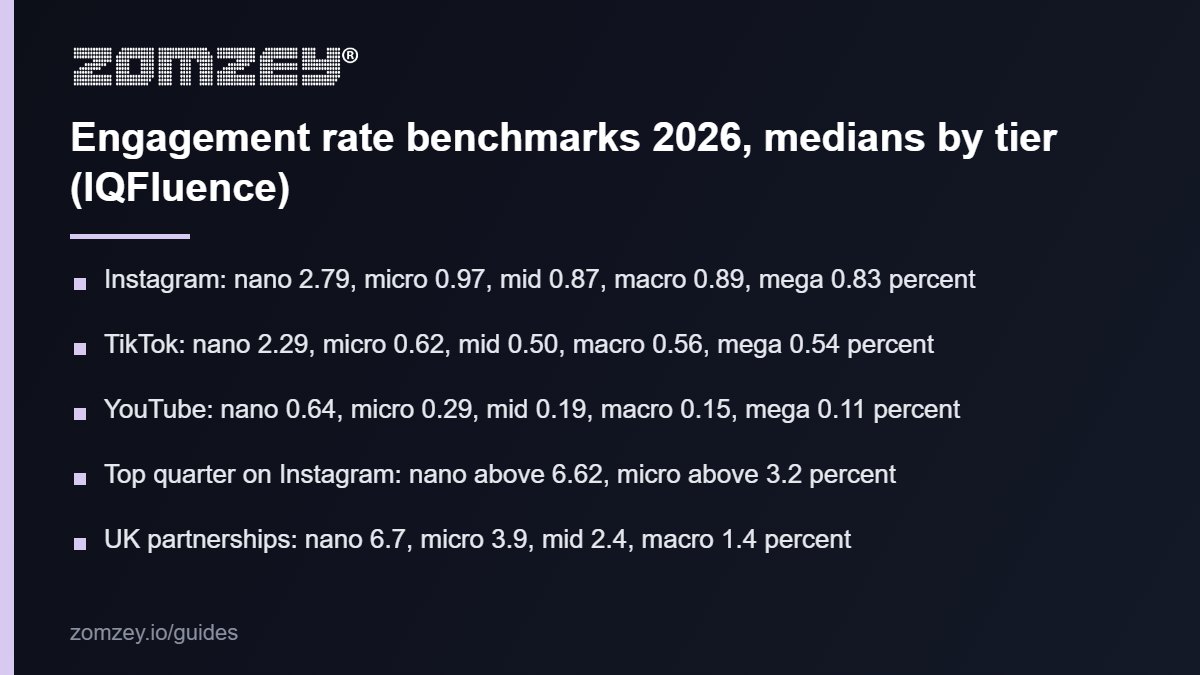
The figures below come from IQFluence’s September 2026 benchmark report, which measured 141.7 million public creator accounts with at least 1,000 followers and at least one post in the previous 30 days. Tiers are nano (1,000 to 10,000 followers), micro (10,000 to 100,000), mid-tier (100,000 to 500,000), macro (500,000 to one million) and mega (over one million). Other sources draw the lines differently (Whito, used in our rates guides, treats 100,000 to 500,000 as macro), so compare a creator against the tier definition the benchmark uses. The median is the figure half of creators sit above; the 75th percentile marks a strong account.
Instagram engagement rate benchmarks
Nano accounts have a median engagement rate of 2.79 percent, with the top quarter above 6.62 percent. Micro accounts fall to a median of 0.97 percent (top quarter above 3.2 percent), mid-tier to 0.87 percent, macro to 0.89 percent and mega accounts to 0.83 percent, with the top quarter of the largest accounts above 2.24 percent. The averages are far higher than the medians (5.93 percent for nano and 4.06 percent for micro) because a minority of very engaged accounts pull them up, which is why an “average Instagram engagement rate” of 4 or 5 percent misleads almost everyone who reads it.
TikTok engagement rate benchmarks
TikTok’s medians run a little below Instagram’s by the follower-based definition: 2.29 percent for nano accounts, 0.62 percent for micro, 0.50 percent for mid-tier, 0.56 percent for macro and 0.54 percent for mega accounts. The spread is wide, with the top quarter of nano accounts above 4.78 percent and the top tenth above 9.38 percent. On TikTok, views matter more than this figure, because the algorithm shows videos to people who do not follow the creator, so brands buying TikTok content usually ask for average views per video as well.
YouTube engagement rate benchmarks
YouTube has the lowest engagement rate benchmarks of the three because subscribers rarely like or comment relative to the number who watch: medians of 0.64 percent for nano channels, 0.29 percent for micro, 0.19 percent for mid-tier, 0.15 percent for macro and 0.11 percent for mega channels. A micro channel above 1.19 percent is in the top quarter. Watch time and average views are the figures that price a YouTube integration; the engagement rate is a check on whether the audience is present, not the main measure.
What “good” means for your size
Against the engagement rate benchmarks above, good is above the median for your platform and tier; strong is above the 75th percentile; exceptional is above the 90th. A 5,000-follower Instagram creator at 3 percent is doing well; a 50,000-follower creator at 3.5 percent is in the top quarter of micro accounts and should price accordingly. The same 3 percent on a 400,000-follower account would be well above the top quarter for mid-tier, and a brand would want to understand why before paying for it. Compare like with like, and put the tier next to the figure whenever you quote it.
Why deal-level engagement runs higher
Benchmarks across every active account include many accounts that nobody would book. Figures from completed brand partnerships are higher. Visionary Marketing’s 2026 study of 92 UK brand and creator partnerships found median engagement of 6.7 percent for nano creators, 3.9 percent for micro, 2.4 percent for mid-tier, 1.4 percent for macro and 0.9 percent for mega accounts. Both sets of engagement rate benchmarks are useful: the population figures tell you where a creator sits among everyone, and the partnership figures tell you what brands that get results have been paying for.
How engagement rate benchmarks feed into price
Two creators with the same follower count and engagement rates of 1 percent and 4 percent are not the same product, and the price should say so. The free influencer pricing calculator uses engagement as one of its inputs, and our guide to influencer rates by platform shows how far it moves a quote on each platform. For brands, this is the arithmetic behind the case for smaller creators: at the micro tier a higher engagement rate buys more real attention per pound, which is set out in our guide to micro influencers in the UK.
How brands spot inflated engagement
An engagement rate far above the 90th percentile in the engagement rate benchmarks for the tier is a prompt to look closer, not proof of anything. Check whether the comments read like people who watched the post, whether likes arrive in natural waves rather than in a block, whether the follower history shows sudden jumps, and whether the audience’s countries make sense for the content. Then ask for screenshots from the creator’s own analytics, which show reach, saves and audience demographics the public figures cannot. On ZOMZEY, creators connect their accounts so the figures on their profiles are validated rather than typed in, and reviews from completed deals show how the audience actually responded.
How creators and Influencers lift engagement honestly
Post for the people who already follow you rather than for a hypothetical new audience, reply to comments in the first hour, ask one clear question per post, use formats that invite a response (carousels and polls on Instagram, replies and stitches on TikTok, community posts on YouTube), and stop chasing followers who will never interact, because every passive follower lowers the rate. Clear out inactive and fake followers where the platform allows it. A smaller, responsive audience is worth more to a brand than a larger silent one, and the engagement rate benchmarks above are the proof.
Using the benchmarks on ZOMZEY
Creators can put their rate next to the tier benchmark on their profile and in their media kit, which answers the question brands ask first. Brands posting an opportunity can state the engagement rate they expect for the tier they want, which filters the offers before they arrive. Every deal is funded under Protected Payments before the content goes live, and the evidence the creator uploads shows the engagement the post actually earned, so the benchmark becomes a result rather than a promise.
Common questions about engagement rate benchmarks
What is a good engagement rate on Instagram in 2026?
Above 2.79 percent for an account under 10,000 followers, above 0.97 percent between 10,000 and 100,000, and above about 0.85 percent for larger accounts, using likes and comments divided by followers. Roughly two and a half to three times those figures puts you in the top quarter.
Is a 1 percent engagement rate bad?
Not for a micro or larger account on Instagram or TikTok, where 1 percent is around or above the median. For a nano account it is below the median, and on YouTube 1 percent is strong for any channel size.
Why is TikTok’s engagement rate lower than Instagram’s here?
Because this definition divides by followers and TikTok distributes videos far beyond the follower base. Measured by views, TikTok engagement is usually higher. Ask for the definition before you compare.
Do these engagement rate benchmarks apply in the UK?
The population figures are global and the partnership figures are UK based. Use the global medians to place a creator within their tier and the UK partnership figures to judge what a bookable creator looks like.
How do I calculate my engagement rate?
Add the likes and comments on your last 10 to 12 posts, divide by the number of posts, divide by your follower count and multiply by 100. The free engagement rate calculator does it in a few seconds and shows the platform average alongside.
Should brands pay more for higher engagement?
Yes, within the tier, and the engagement rate benchmarks give you the scale. Engagement is the best public measure of attention, and attention is what the brand is buying. Price the difference rather than paying follower-count rates for a silent audience.
In short, engagement rate benchmarks for 2026 put the median Instagram account at 2.79 percent for nano creators and under 1 percent from the micro tier upwards, TikTok a little below that by followers and YouTube lower again, with deal-level figures from UK partnerships running two to four times higher at the smaller tiers. Judge every creator against their own platform and tier, check the figures from the creator’s analytics, price the difference, and fund the deal before the post goes live.